

Ask an Arista cEOS and a Nokia SR Linux the same two things: how many octets an interface received, and whether it is administratively up. You get two different answers. Not different numbers. Different shapes.
Arista returns them as OpenConfig:
- counters at
/interfaces/interface/state/counters/in-octets, - admin status at
/interfaces/interface/state/admin-status, asUP/DOWN.
Nokia SR Linux native srl_nokia model:
- counters at
/srl_nokia-interfaces:interface/statistics/in-octets, - admin status at
/srl_nokia-interfaces:interface/admin-state, asenable/disable.
Same facts. Different paths, different leaf names, different value vocabulary.
You guessed it, it's where network monitoring breaks.
The cost of multivendor data shapes
The counter values aren't the even hardest part. The trickiest part is everything downstream of them.
If your data carries the vendor's shape all the way to the dashboard, then every Grafana panel, every Prometheus rule, every alert threshold has to know which vendor it is looking at.
admin-status == "UP"for one fleet,admin-state == "enable"for another.
One PromQL query becomes two. A "shut interfaces" panel becomes a per-vendor OR. And the day you add a third platform, you go back and change all of it again.
You end up maintaining the same logic again and again, once per vendor. The network is no more complex than before. Only the data shape changed.
And it shows up at the worst time. It's 2am, you filter for the interfaces that are shut, and the panel is wrong: half the fleet reports disable, and the rule only matches DOWN.
Nobody wrote a bug. The query was simply never told that two vendors name the same state differently. These problems are hard to spot. They show up on the one device nobody handled separately.
Where to absorb the difference
You can normalize in three places, and only one of them scales.
- In the dashboard. Grafana transforms and value mappings do the job. The work only ever helps that one dashboard: the next panel, the next person's dashboard, the alert rule that skips Grafana entirely, none of them benefit.
- In Prometheus. Relabeling and recording rules make it more reusable. But now you handle the vendor differences in PromQL, far from the device that caused them, and every consumer still has to trust the rules are complete.
- At collection time. The difference never leaves the collector. One place already has to be vendor-aware: the part that talks gNMI to the box. That is the place that resolves the vendor's shape.
Everything downstream receives data with no vendor-specific shape left in it. You write the translation once, next to the device knowledge that explains it. Then you stop redoing it in every tool that reads the data later.
It's the same idea as checking input once, at the boundary, instead of repeating the check everywhere. Handle the difference where it enters, and the rest of the system can assume it is already gone.
The concept: normalize once, at collection time
The idea is to keep the vendor's shape from leaving the collector. You define one model with vendor-neutral field names, and you attach one mapping per vendor that translates that vendor's paths and values into your field names.
The vendor difference is handled at the edge. Everything past that point sees a single, stable shape: Prometheus, Grafana, your alerts, an AI agent reading the data.
For interface state, that model is eight fields:
interface-name, admin-status, oper-status, mtu, in-octets, out-octets, in-errors, out-errors.
Those names never change, whoever made the box. The pipeline looks like this:
                          ┌── Arista cEOS  (OpenConfig)
Devices ──(gNMI)──────────┤                                 one model,
                          └── Nokia SR Linux (srl_nokia)    per-vendor mapping
                                      │
                                      ▼
                          Prelude Collector ──(/metrics/collector)──► Prometheus ──(query)──► Grafana
Two vendors go in. One shape comes out. Here's what that looks like end to end, in the web UI.
Two vendors, one collector
Start with the devices. Two boxes from two vendors, an Arista cEOS and a Nokia SR Linux, added to the collector and connected over gNMI. Nothing vendor-specific happens here yet. They are just two gNMI targets.
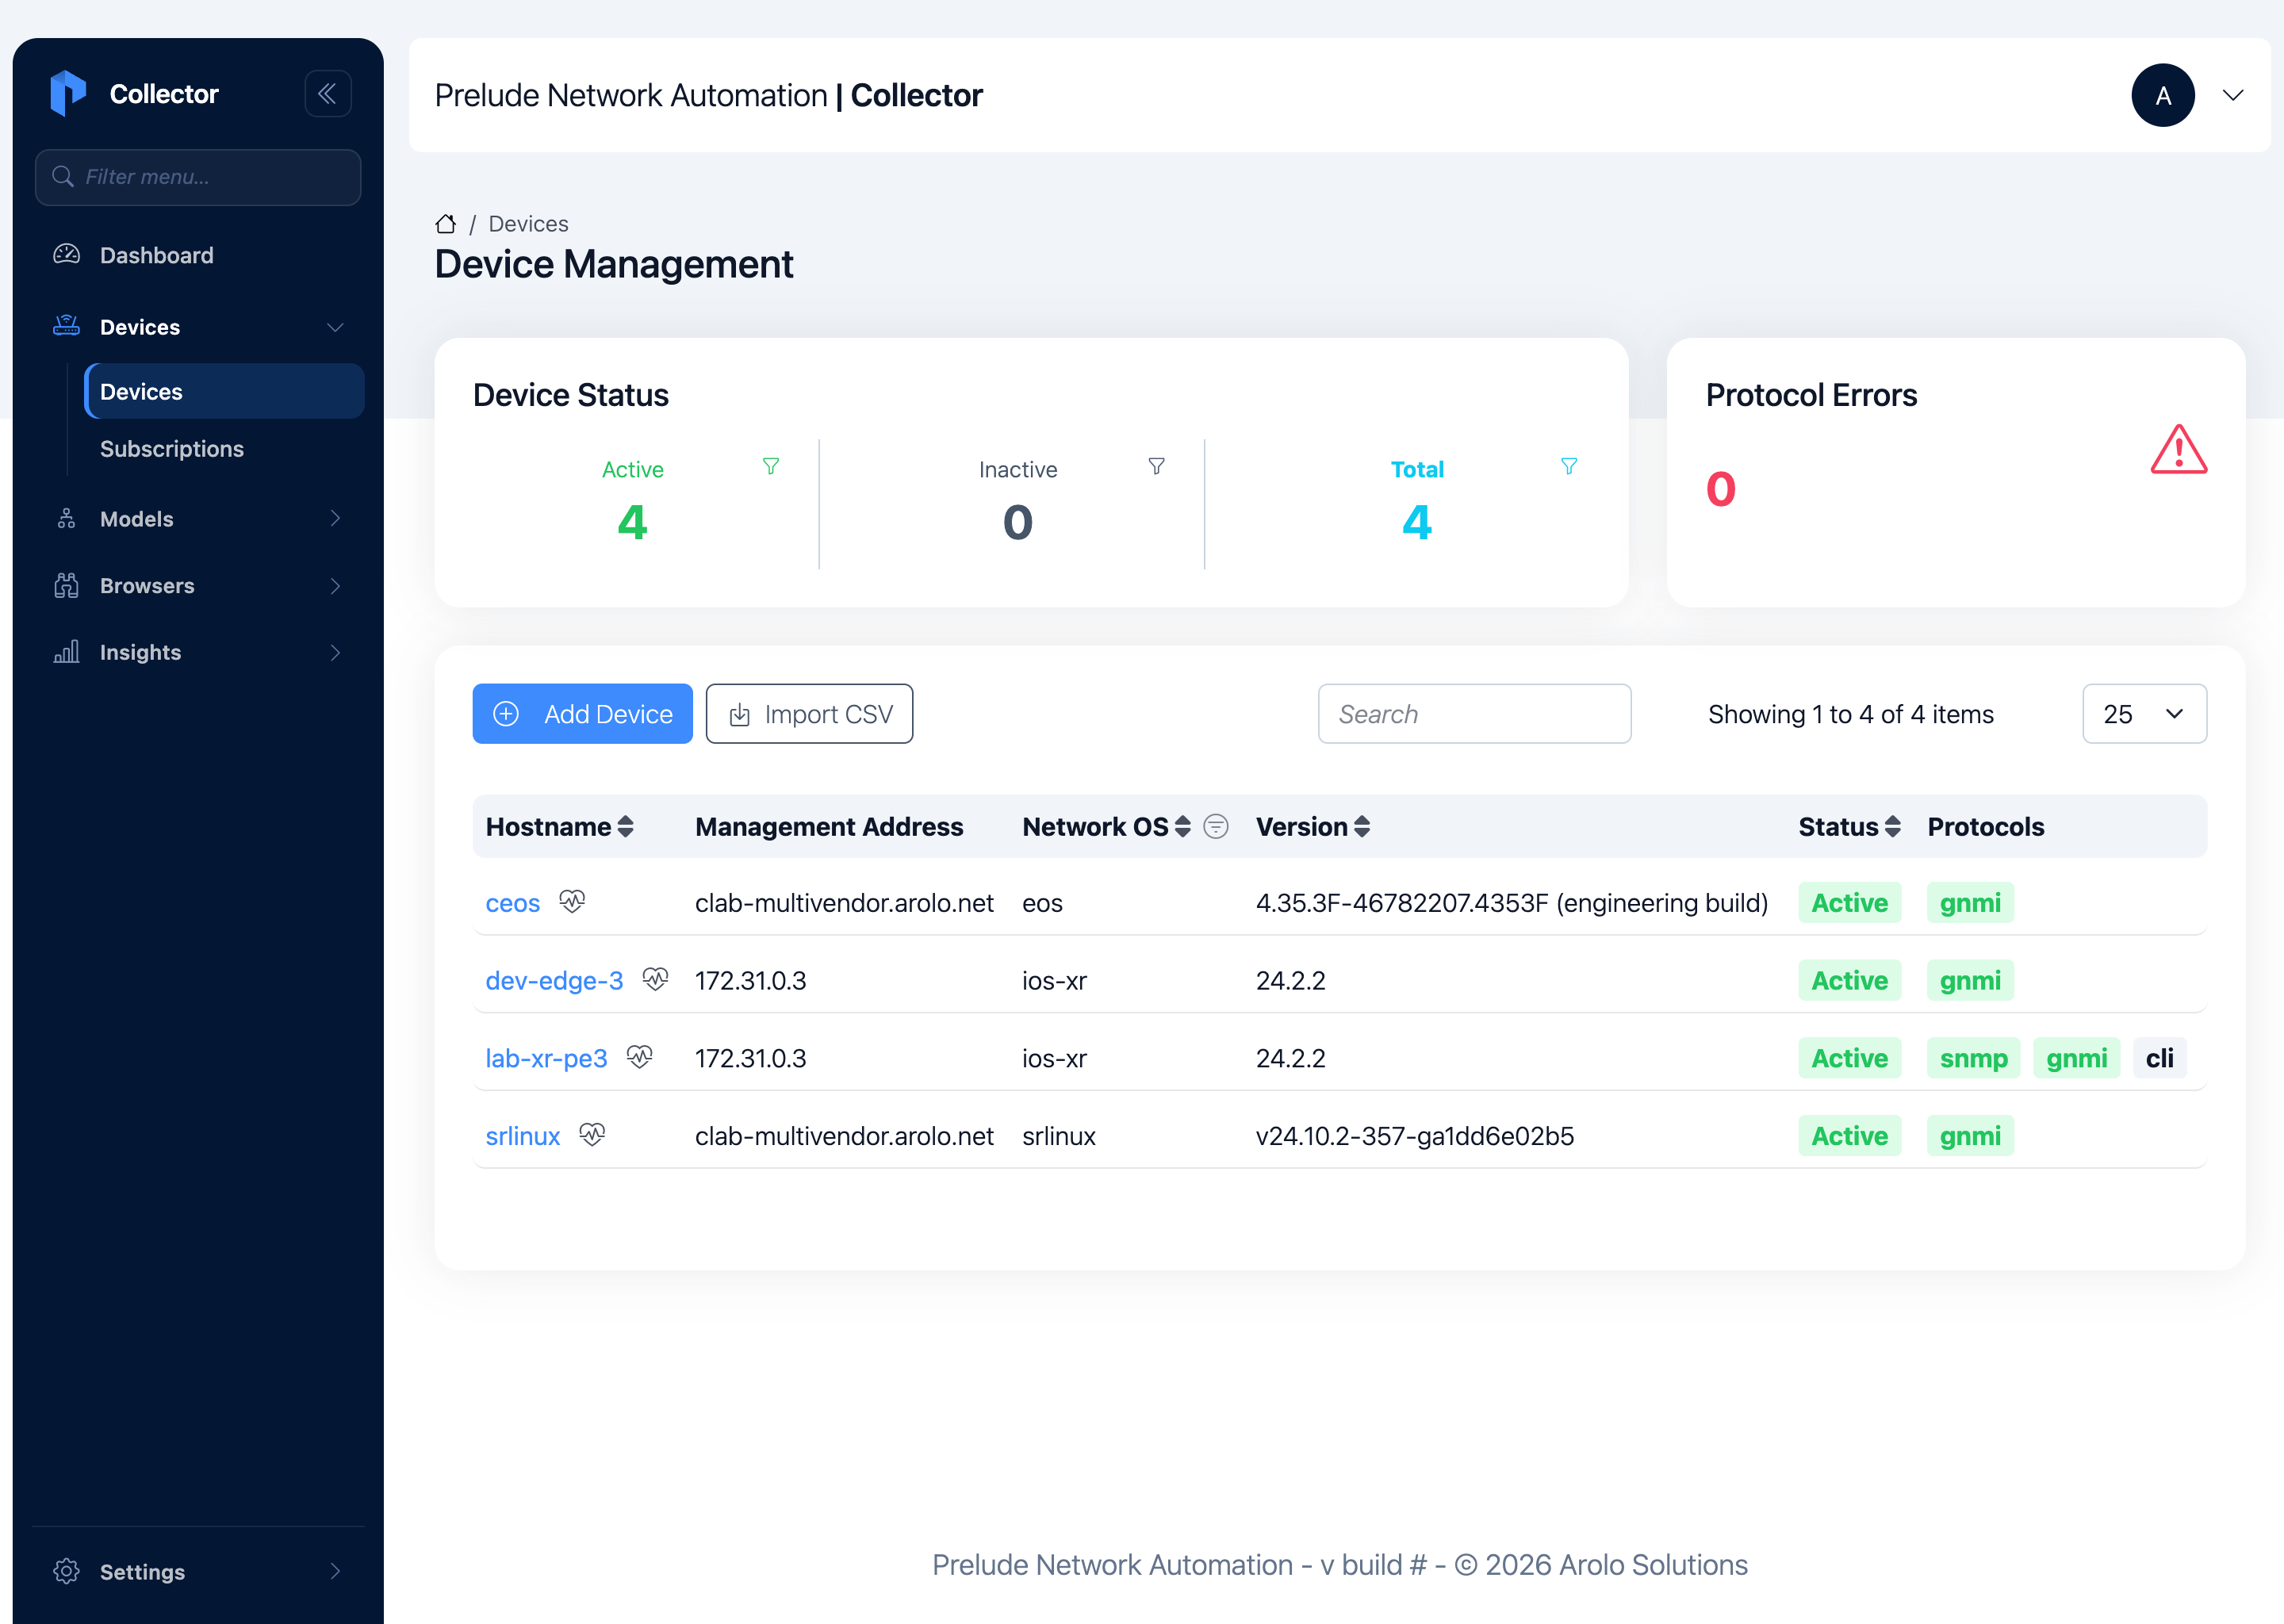
The collector already knows how to talk to each one. What it doesn't know yet is that the two devices are saying the same thing in different words. That is what the model handles.
One model, per-vendor mappings
In the collector you create an interface-state model: eight vendor-neutral fields, plus a gNMI mapping for each vendor (Arista's OpenConfig paths, Nokia's native srl_nokia paths). One definition, one translation per vendor. The full model, with both mappings, is written up in the tutorial linked at the end.
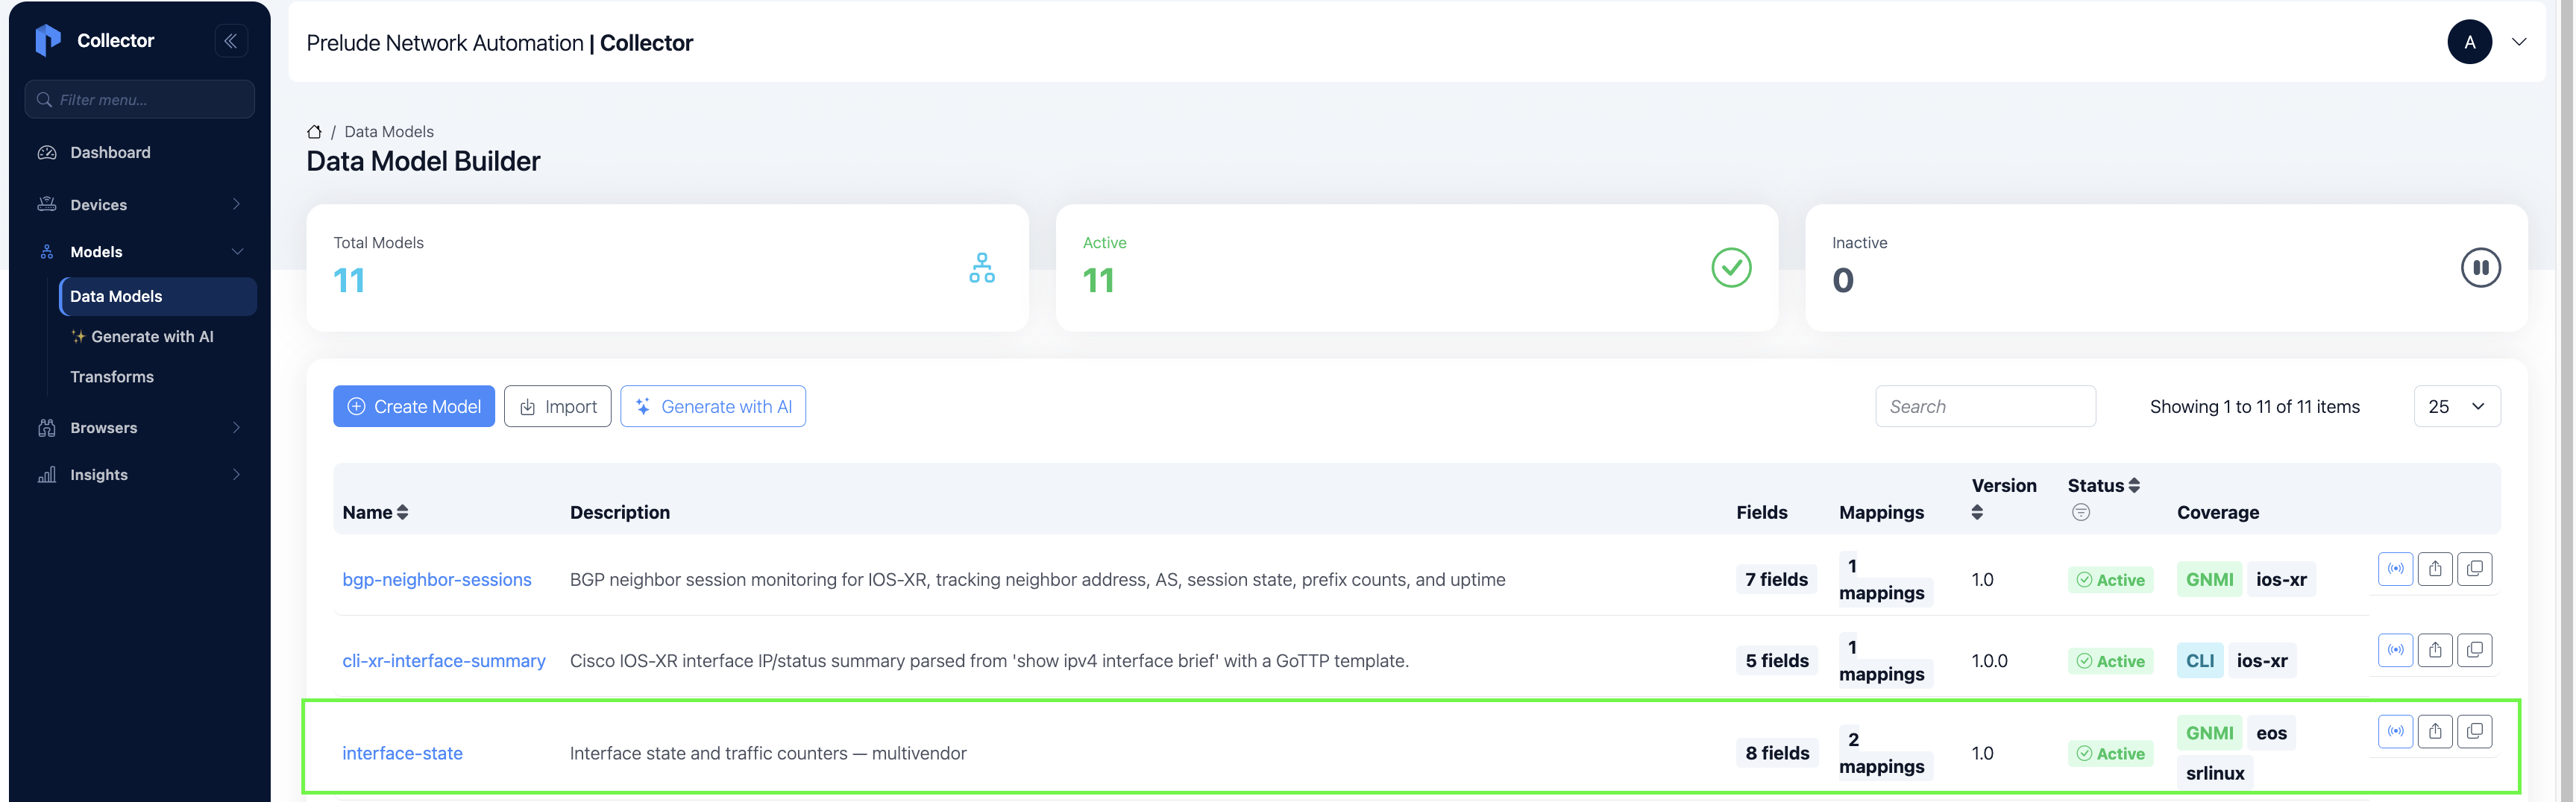
The interesting work is in the mappings, and it's more than renaming paths. A mapping normalizes three things at once:
- Paths. Arista's OpenConfig path and Nokia's
srl_nokiapath both feed the same field. - Value vocabularies. Arista's
UP/DOWNand Nokia'senable/disableboth have to map to the sameadmin-statusvalues, or your downstream logic depends on the vendor again. - Units. A counter has to mean the same thing too. In our model,
in-octetsandout-octetsare always in octets. If a vendor reported its counter in bits, or in megabits, the mapping converts it to octets on the way in. So the numbers are directly comparable across the whole fleet, with no per-vendor scaling factor to remember later.
So the field doesn't just have the same name across vendors. It has the same meaning.
The proof: compare vendors side by side
This is the step worth pausing on. Before you build a single dashboard, the collector can test both mappings against the live devices and show you the result field by field, one vendor next to the other.
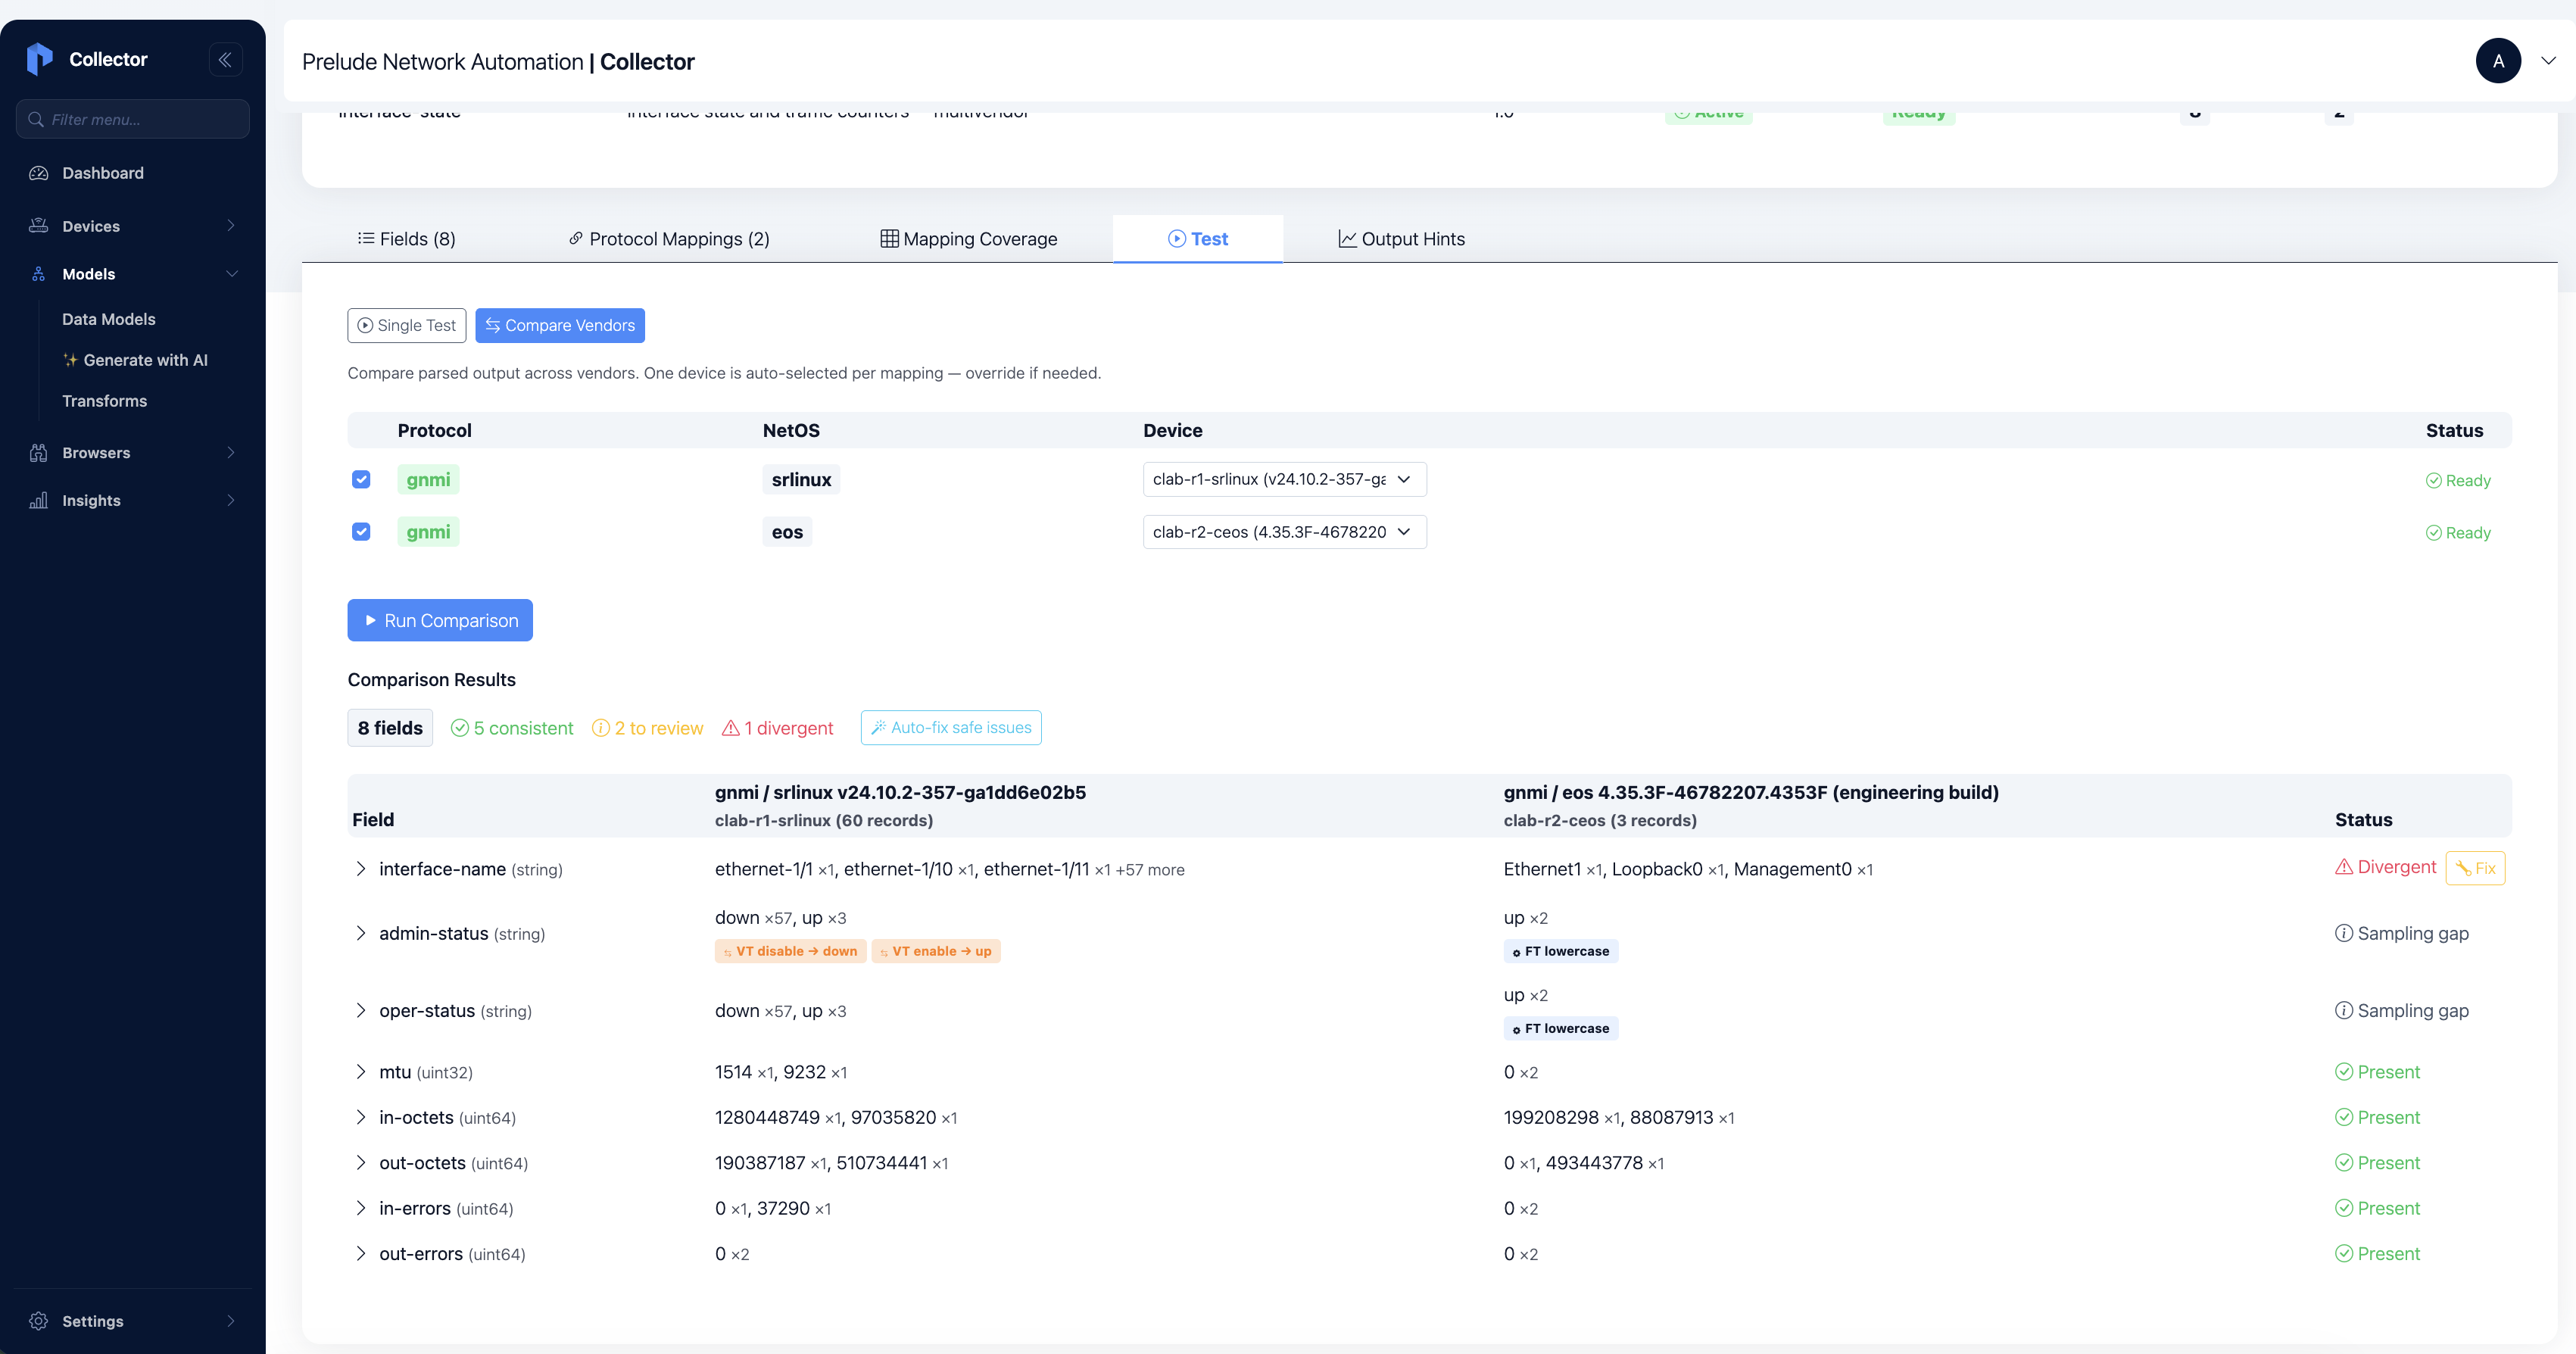
Two devices, two completely different native models, and the output columns line up exactly. admin-status reads the same on both. in-octets reads the same on both.
This is the consistency we were after, verified against real devices, not assumed from a spec. Everything after this step is simple, precisely because this step was not.
From here it is routine: start a subscription on each device, and the collector streams normalized fields continuously.
From the collector to Grafana
The collector can send its output to several backends. For this post we use Prometheus: it exposes every collected field on a /metrics/collector endpoint.
You enable that output in the UI and set the Output Hints, so each field is exposed the right way: counters for the octet fields, an info series for the status labels.
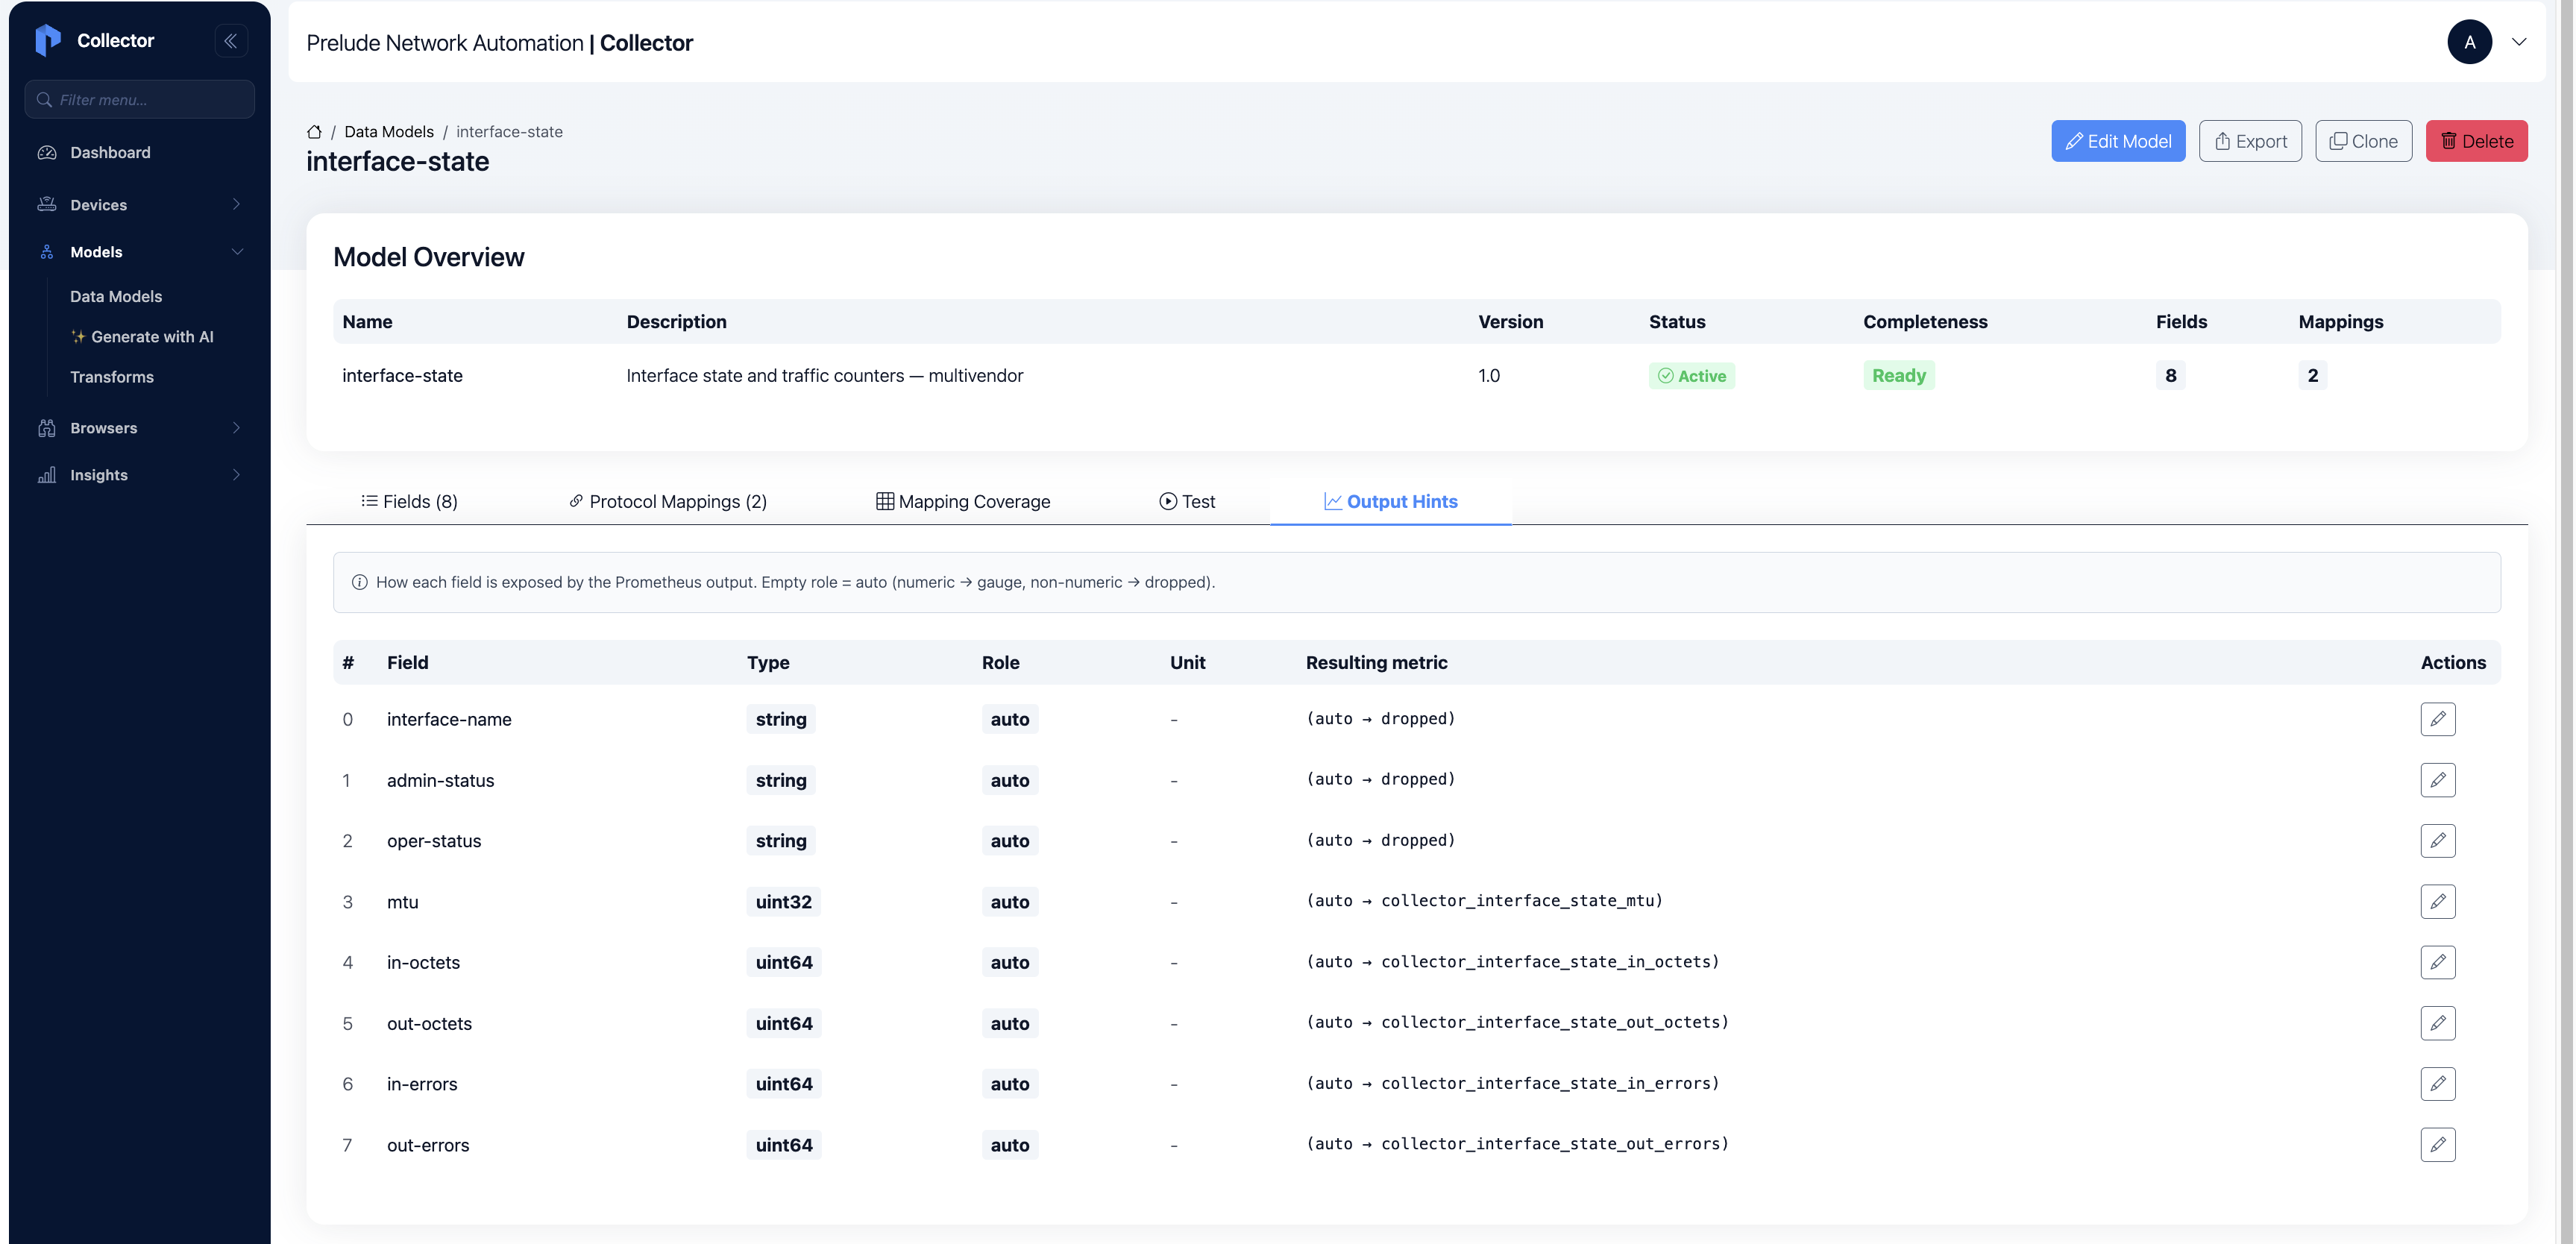
From there it is standard Prometheus and Grafana: point Prometheus at the endpoint, add it as a Grafana data source, and import a ready-made dashboard.
That's only a few UI steps, and the full click-by-click guide is already written, linked at the bottom. The point here isn't the setup. It's what you see once it is done.
One dashboard, every vendor
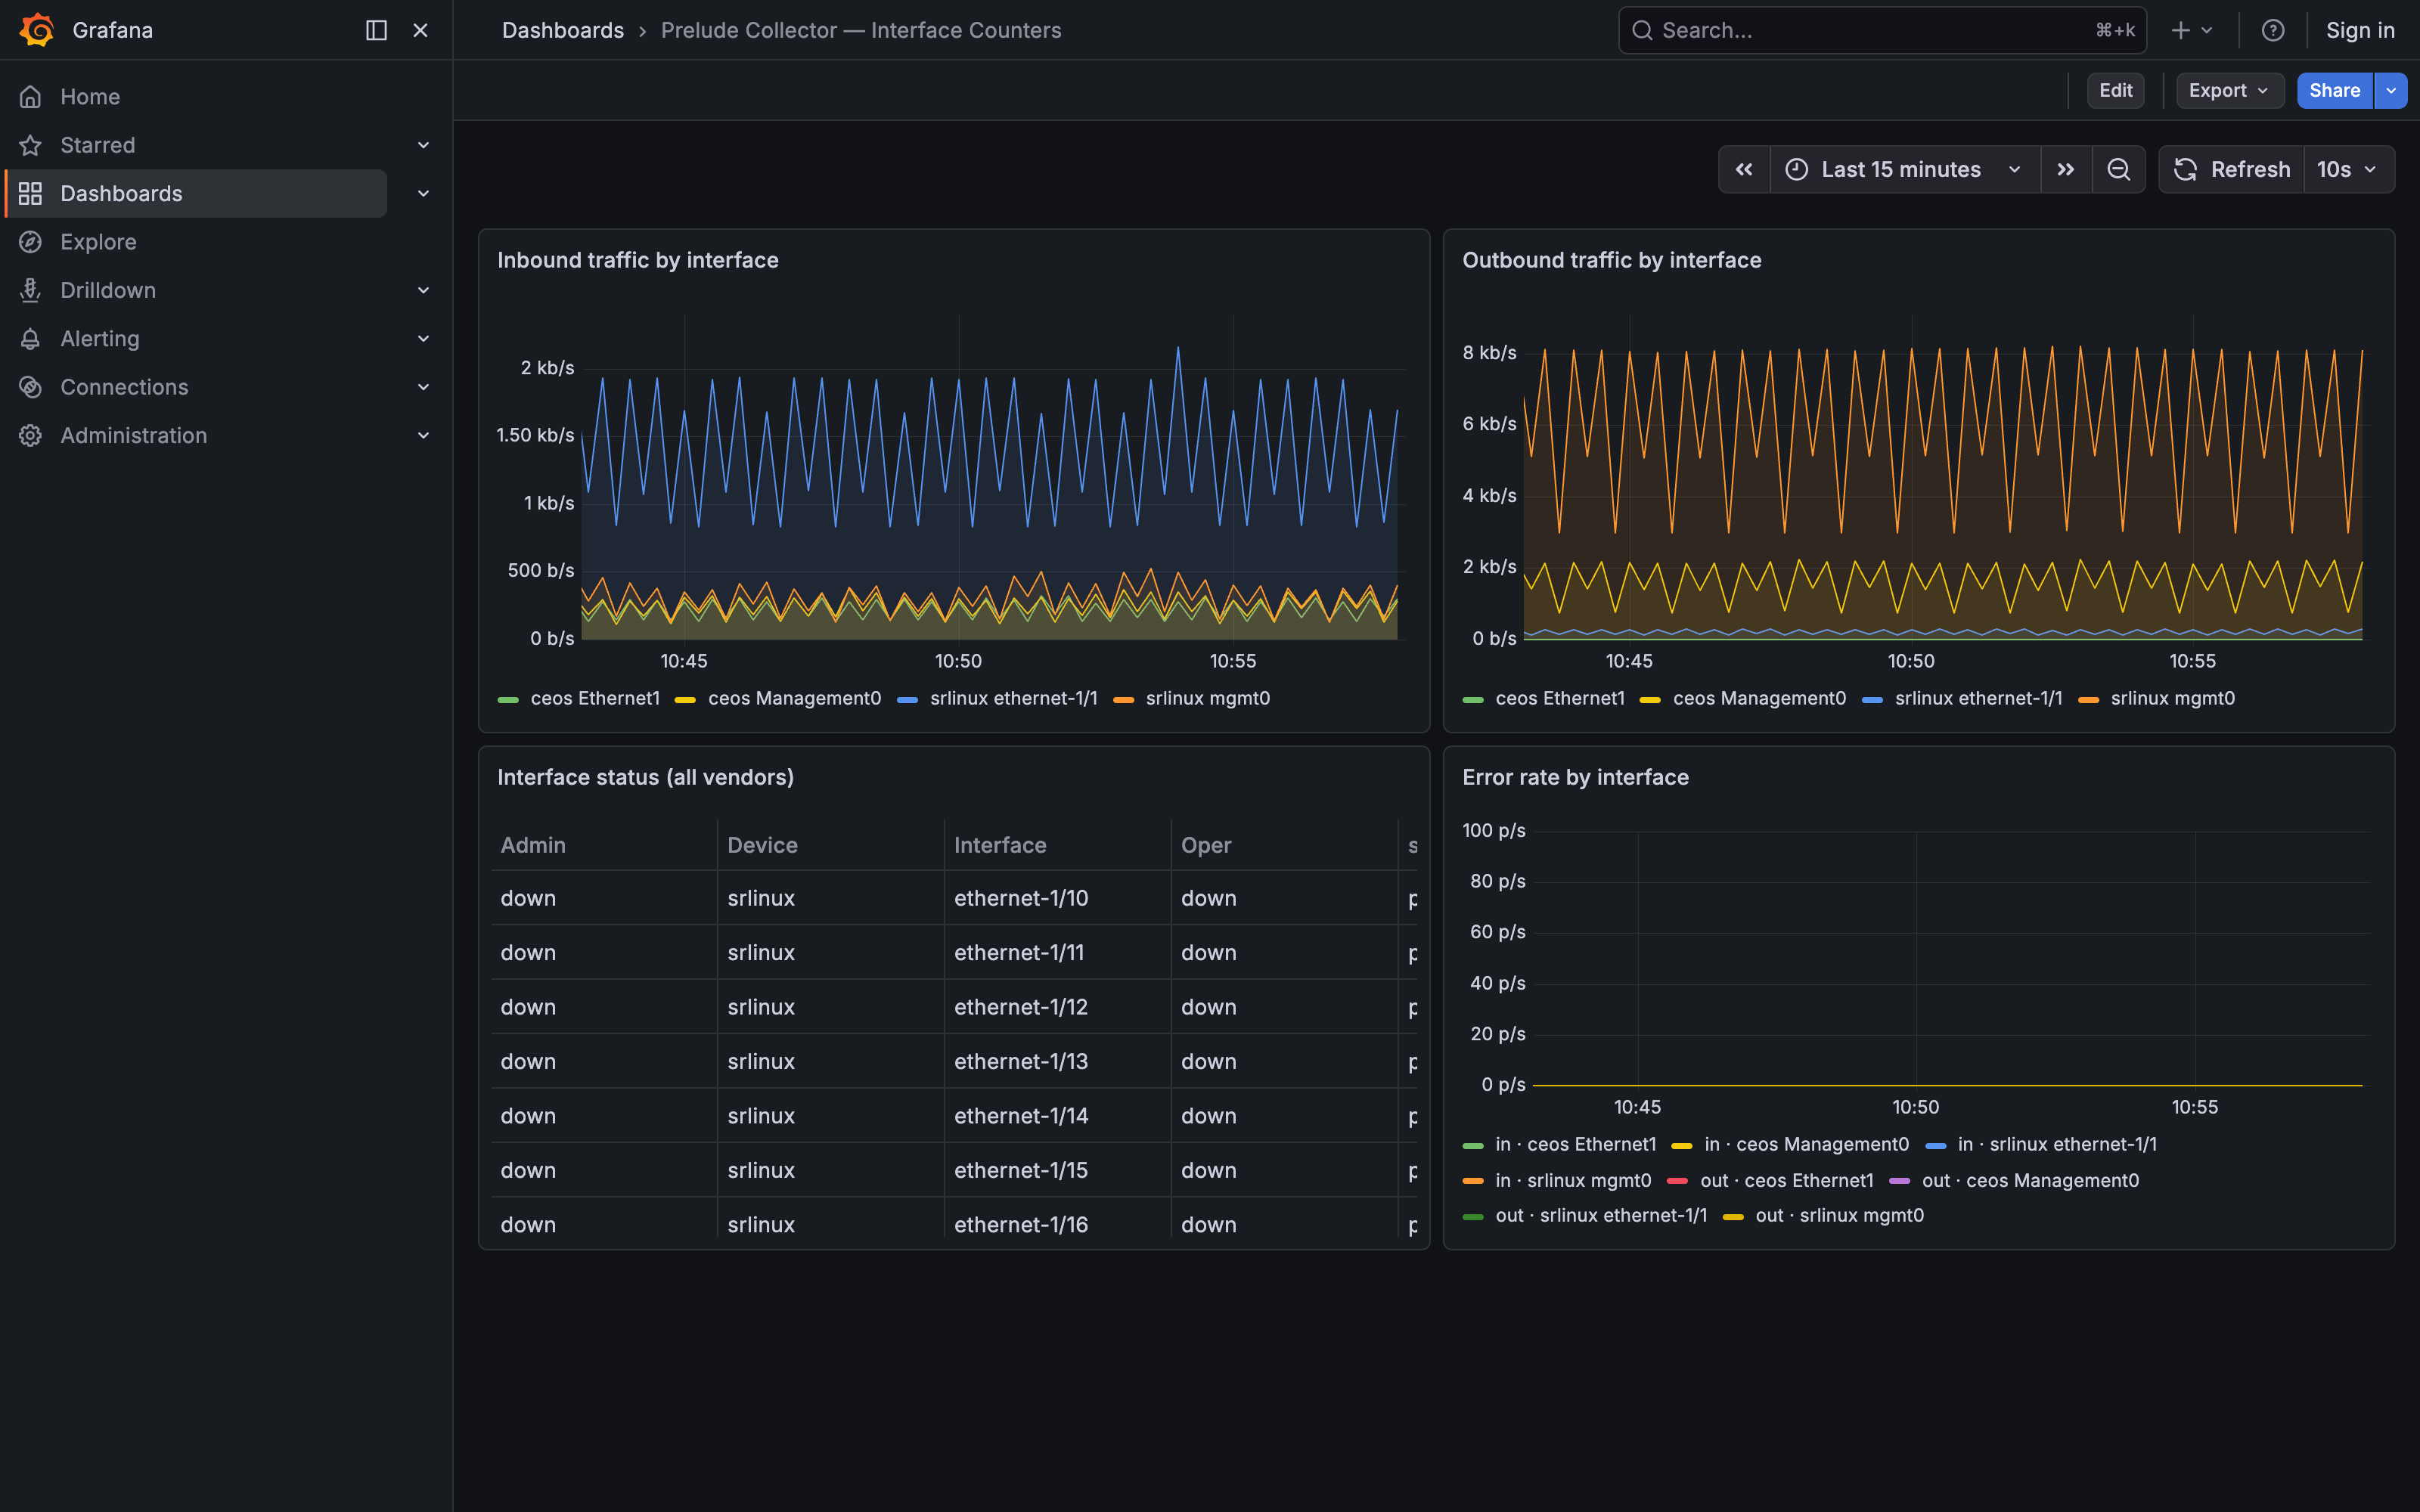
There's the result. Inbound and outbound traffic, interface status, error rates: every device subscribed to interface-state shows up in the same panels. The Arista and the Nokia appear side by side, separated only by a device label. No per-vendor query. No OR clauses. No special cases.
And it stays that way. Add an SR OS box, a Cisco IOS XR box, anything: you write one more mapping into the same model, start a subscription, and it appears in these panels automatically. You never touch the dashboard for a new vendor. It only ever sees one shape.
And the dashboard is only the most visible consumer. The same normalized fields feed your Prometheus alert rules, where one oper-status expression covers the whole fleet. They also feed anything else that reads the collector's output.
If you point an AI agent at your network, it gets the same clean shape: it works with oper-status and in-errors, not with whichever vendor is answering. Clean ground truth, with no vendor-specific format to learn.
That is the whole idea: do the vendor-specific work once, at the edge, where it stays contained and testable. Then the rest of your stack never has to do it.
Try it on your own network
Everything above runs in the collector's web UI, and the full step-by-step is in two tutorials:
- Interface state across vendors: build the model, write both mappings, and verify them against live devices.
- Send data to Grafana: set up Prometheus and Grafana, expose the metrics, and import the dashboard.
Prelude Collector is free for up to 20 devices. A single docker compose up -d and you're collecting. If you run a multivendor network and want to see your own devices in one shape, reach out for a demo.