
OneBoard Module
Operational State Management. Capture and compare snapshots of device operational state for validation and compliance.
Features
Take point-in-time snapshots of device operational state, compare them side-by-side, and confirm that changes were applied correctly.
Capture point-in-time snapshots of device operational state on demand or on a schedule, with a full historical archive.
Retrieve and compare any operational state from your devices: interface state, neighbor adjacencies, or MAC address count, all in a single unified snapshot.
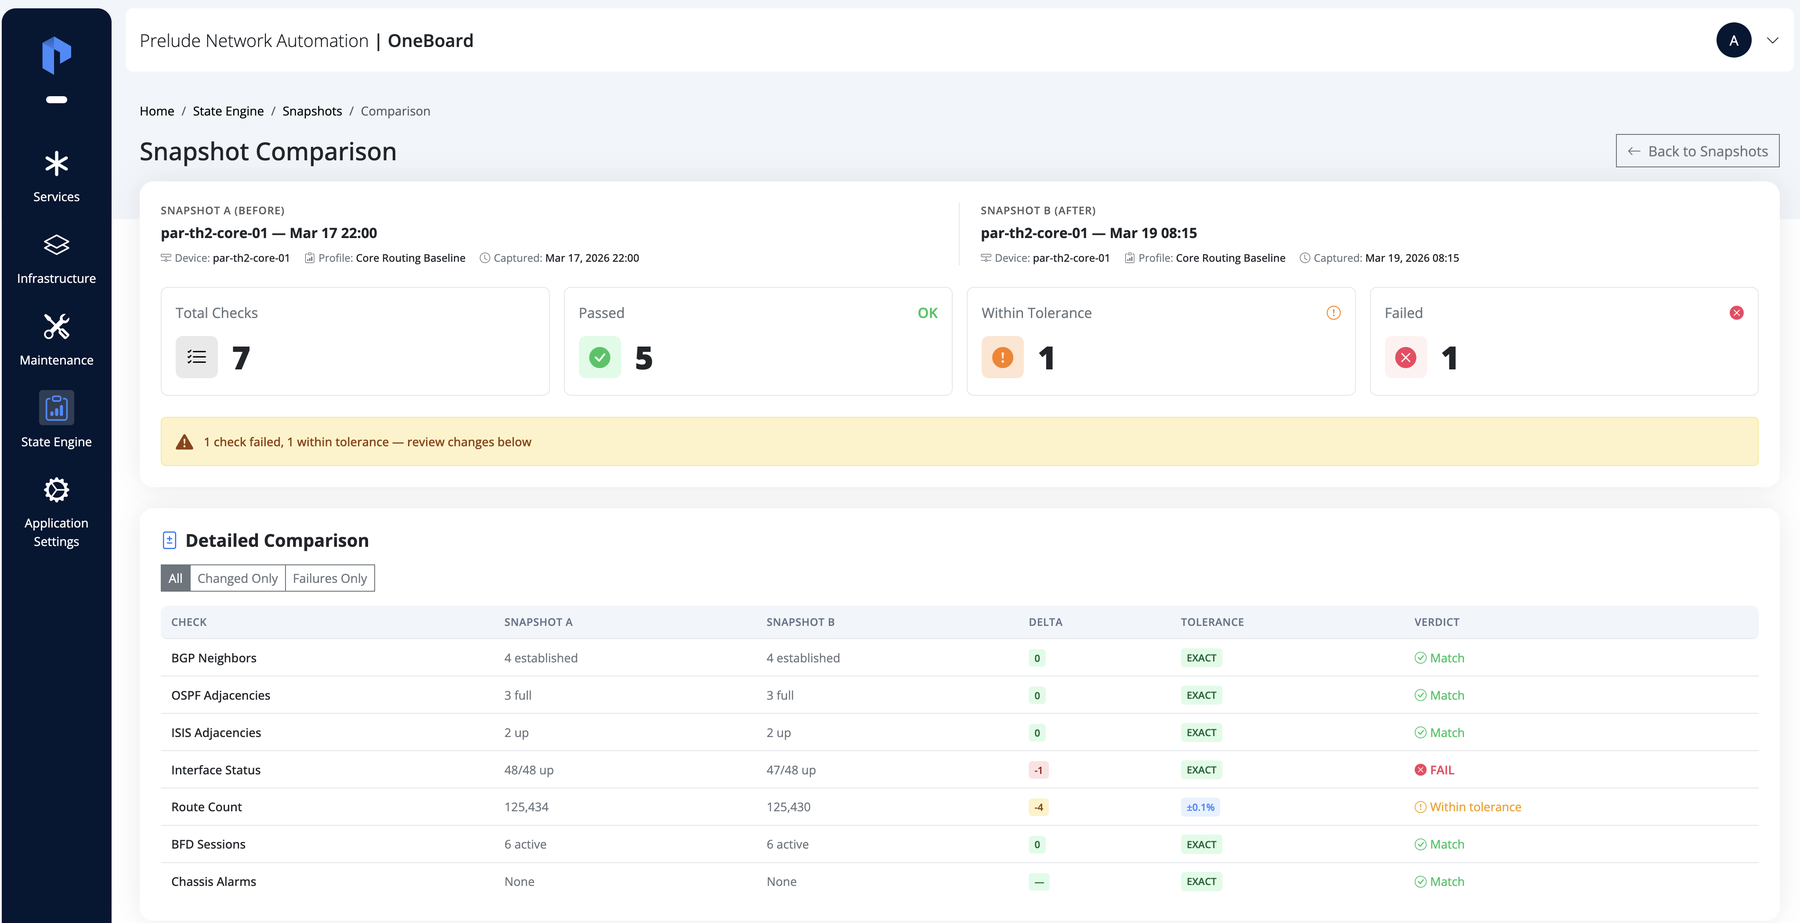
Side-by-side comparison of any two snapshots to identify exactly what changed between two points in time.
Detailed, highlighted diff reports showing expected versus actual operational state, with alerts on unexpected changes.
Automatically confirm that maintenance operations completed as expected by comparing pre and post-intervention snapshots.
Define expected state baselines and alert operators whenever the network deviates, enabling continuous compliance assurance.
Manual post-change verification
Engineers SSH into devices after maintenance, eyeball CLI output, and hope nothing was missed.
Automated pre/post comparison
Snapshot before and after an intervention. Get an instant diff report confirming every expected change landed and nothing unexpected shifted.
Scattered commands, impossible scale
Checking state across hundreds of devices means thousands of CLI outputs. No human can realistically review or compare them all.
Unified snapshots, surfaced insights
All device state captured in a single queryable snapshot. The engine processes the volume and surfaces only deviations and diffs that matter.
Compliance checked on a spreadsheet
Operators manually compare device state against a baseline doc, often only during audits, so drift goes unnoticed for weeks.
Continuous compliance baselines
Define expected state once. The engine alerts operators the moment the network deviates, replacing periodic audits with continuous assurance.
Recreating state from memory
When an incident hits, the team scrambles to figure out what the network looked like before the problem started, piecing together logs and recollections.
Historical state archive
Browse and compare snapshots from any point in time to pinpoint exactly when and what changed, accelerating root-cause analysis.
All Prelude products are accessible through our MCP Server. Connect your AI tools and agents to query network data, trigger automations, and integrate Prelude into your AI-driven workflows.
Estimated annual cost based on managed devices
| Component | Est. annual cost |
|---|---|
| Prelude Collector | 14 000 € |
| Prelude State Engine | 11 000 € |
| Estimated total | 25 000 € / year |