

Operators ask us this a lot, before they run the collector against a real fleet: how far does it go? Not ten devices, and not a handful of demo boxes. The hundred devices in the lab, and the thousand in production.
So we measured it. Here's how far it goes.
How we generate the load
To measure a collector under load, you need load, and you need it clean. We generate it with synthetic devices: two small simulators that replace real hardware in the test, so we can grow the fleet to any size and keep the collector as the only thing being measured.
- gNMI, streaming. A tiny gNMI server binds many ports, one logical device per port, and streams OpenConfig
/interfaces/interface/statecounters at whatever cadence you set. - SNMP, polling. An snmpsim instance answers on many ports, each serving a full IF-MIB walk.
Both run on a separate host from the collector. Run the load generator on its own machine and the collector's CPU and memory are the only numbers that move.
collector under test              load host
  (one box)     ── gNMI ──▶   gnmisim   :574xx   (one port = one device, streaming)
                ── SNMP ──▶   snmpsim   :161xx   (one port = one device, polling)
From there it is the same collector you would run in production. The setup is the same few steps you would run by hand:
- Add the devices.
- Attach a model.
- Subscribe each device to it.
- Send the output to wherever the data should go.
We pointed the synthetic devices at a normalized OpenConfig interface model, the same normalize-at-collection-time idea from an earlier post. So the pipeline under test is the real one, not a stripped-down benchmark.
Here is that harness pointed at a single collector:
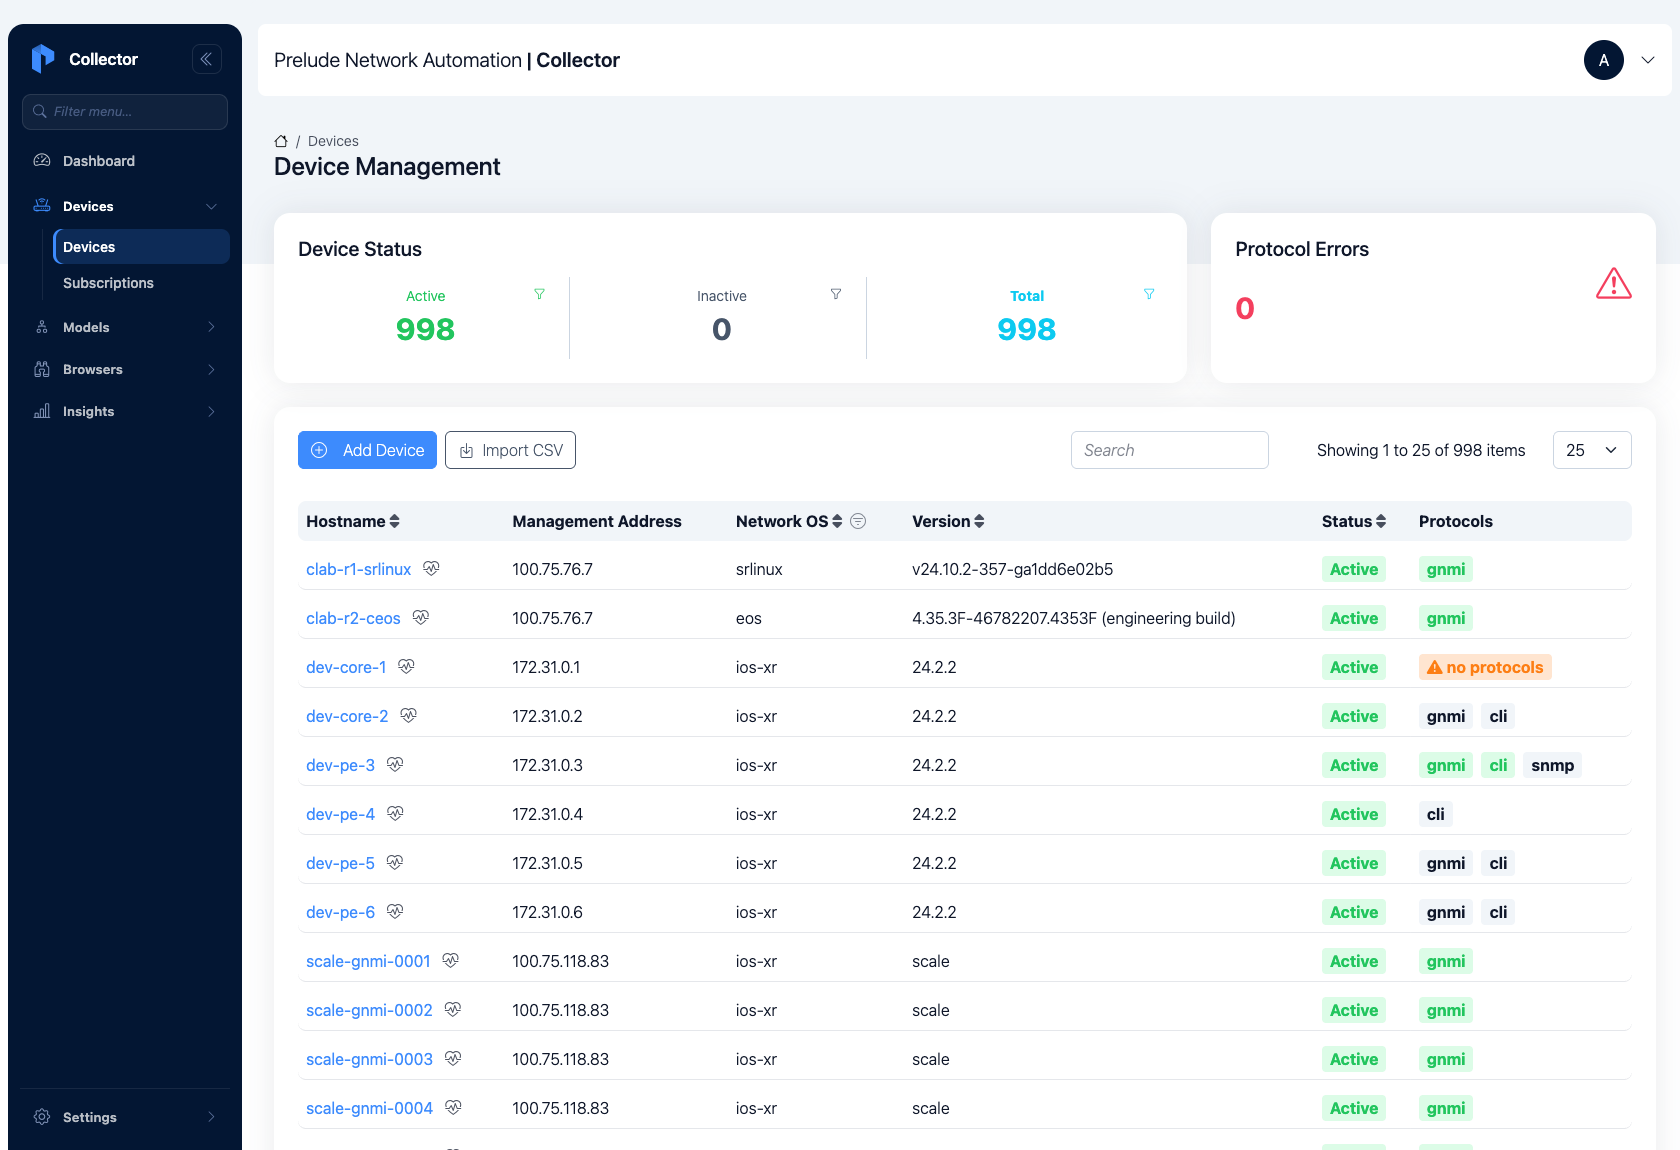
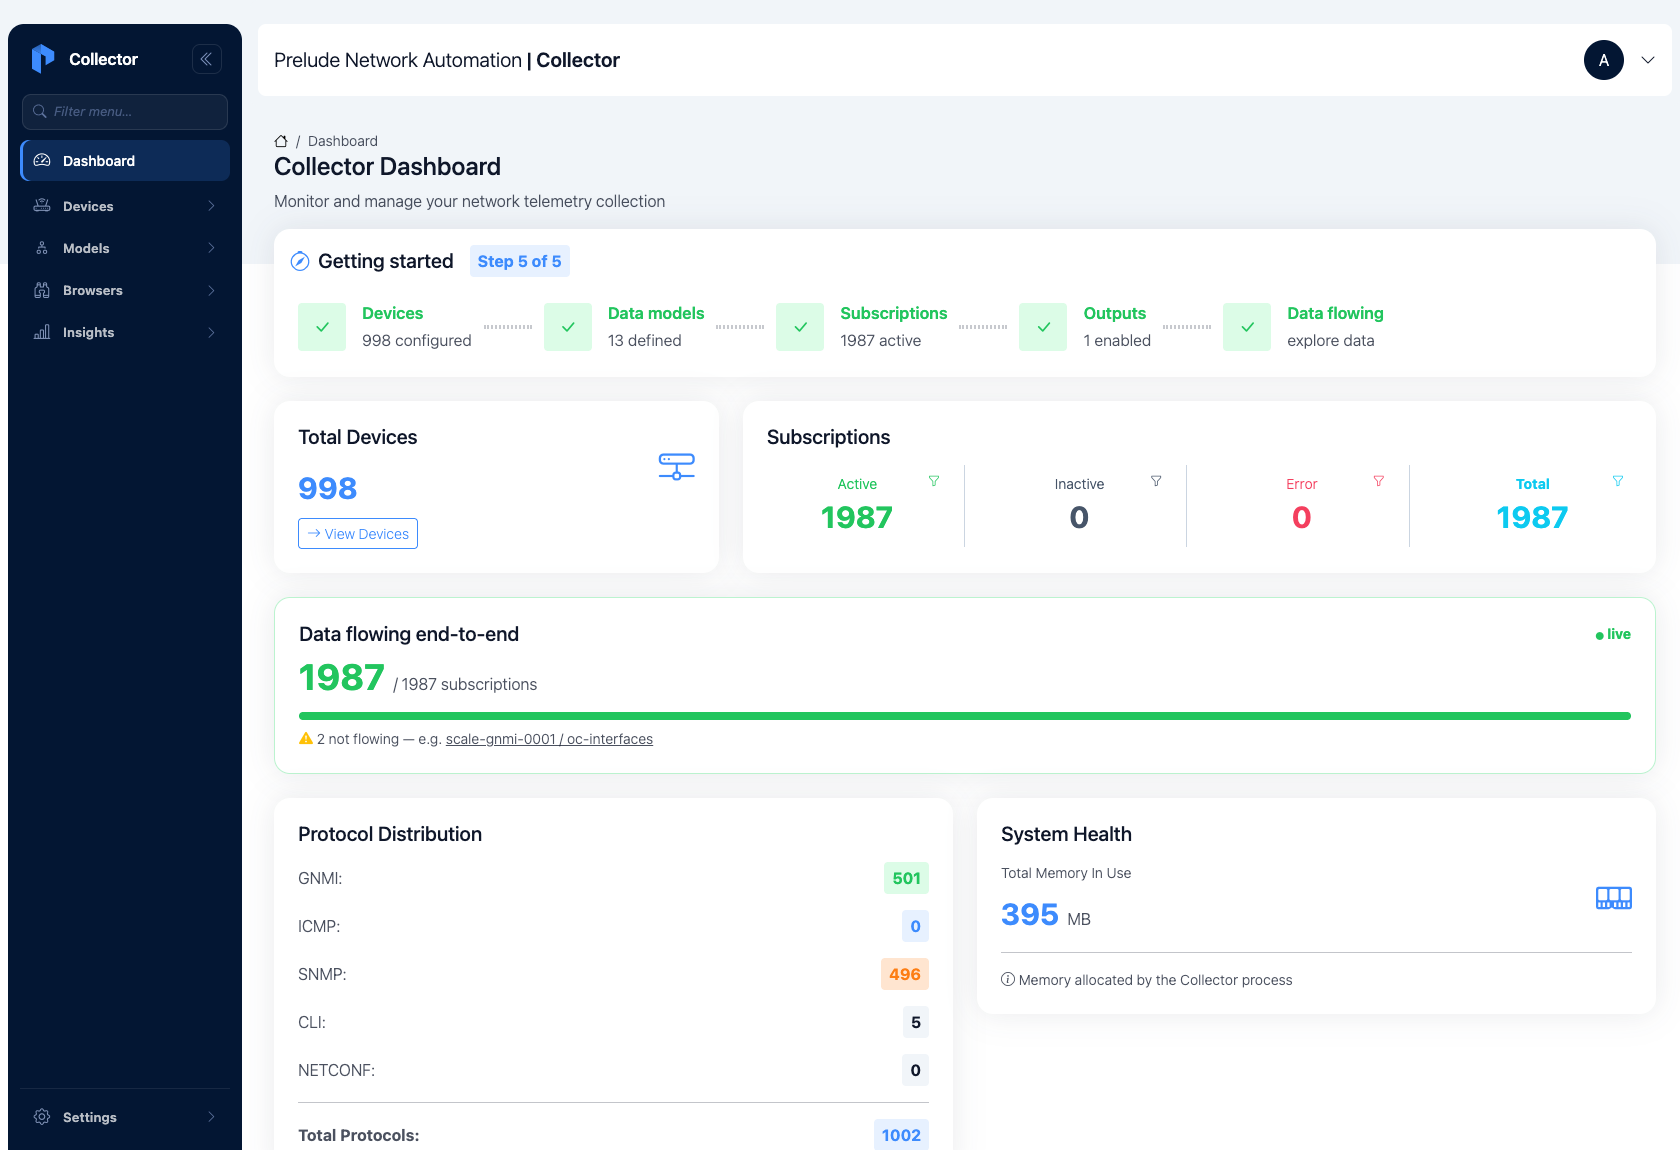
- 998 devices, half streaming gNMI and half polled over SNMP. Every one active, not one protocol error.
- Every subscription runs the full pipeline: connect, collect, parse into the model, push to an output.
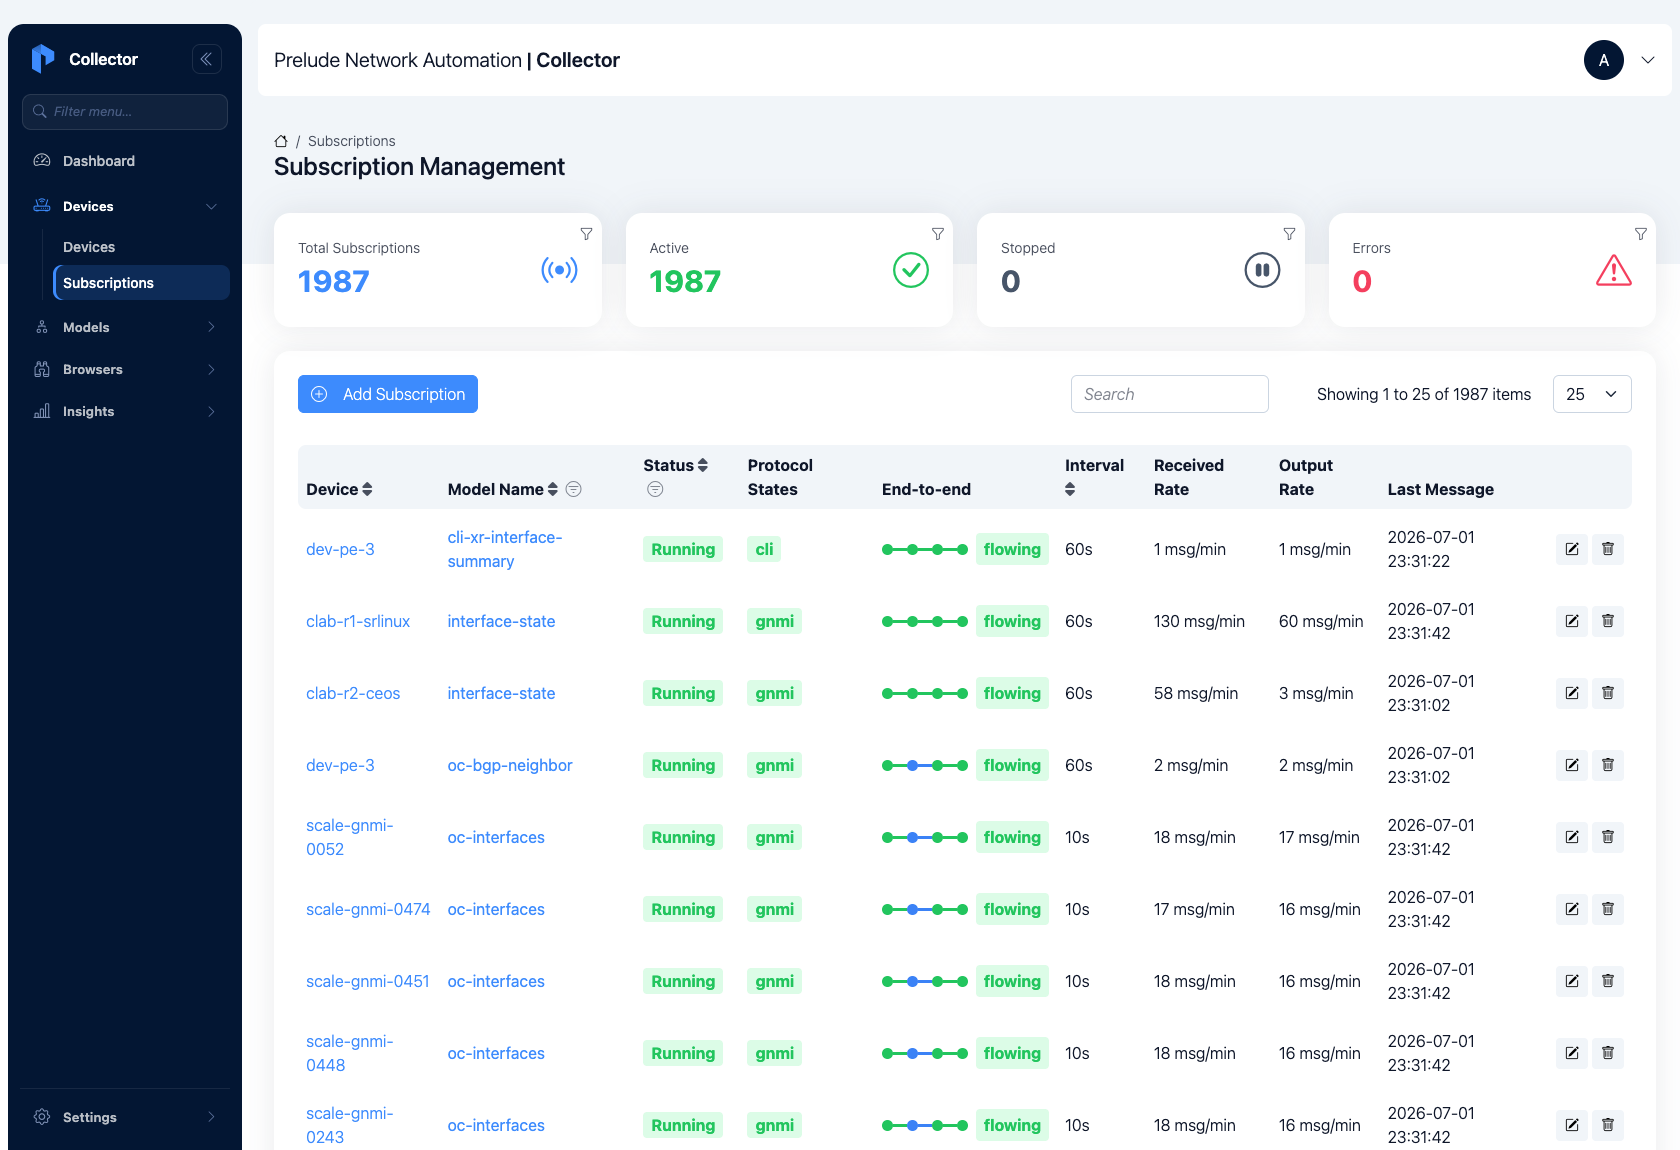
- Two subscriptions per device takes it to nearly two thousand. All of them running, none in error, each gNMI stream updating every ten seconds.
That is the shape of the test. Now the numbers.
The baseline: 100, then 500 devices
Start small enough to trust the numbers, then scale up and watch what moves.
| Baseline | 100 devices | 500 devices | |
|---|---|---|---|
| Subscriptions | 0 | 100 | 500 |
| Messages in / sec | 0 | 800 | 4,497 |
| Messages out / sec | 0 | 683 | 4,017 |
| Collector RAM | 100 MiB | 164 MiB | 355 MiB |
| Peak CPU (of one core) | ~0% | ~5% | 15.8% |
| Dropped messages | 0 | 0 | 0 |
| Subscriptions in error | 0 | 0 | 0 |
At 500 devices the collector was moving about 4,500 messages a second in and 4,000 out, on 355 MiB of RAM and a sixth of one CPU core. No dropped messages. No subscriptions in error.
The numbers matter less than their shape. Going from 100 to 500 devices, memory and throughput both rose with the device count. There was no sudden jump anywhere.
Push it until something runs out
A baseline that behaves is reassuring. The interesting part is what happens when you keep pushing. So we kept going on the same collector, now raising the subscriptions per device from one toward ten on a box carrying roughly a thousand devices, until something ran out.
| Subscriptions | Errors | Messages / sec | Collector RAM | Collector CPU | Host RAM |
|---|---|---|---|---|---|
| 1,000 | 0 | 5,854 | 520 MiB | 14% | 39% |
| 1,987 | 0 | 23,102 | 783 MiB | 15% | 45% |
| 4,000 | 0 | 52,565 | 1,277 MiB | 64% | 58% |
| 6,000 | 0 | 82,599 | 1,746 MiB | 61% | 69% |
| 8,000 | 0 | 117,161 | 2,320 MiB | 72% | 81% |
| 10,000 | 0 | 138,205 | 2,880 MiB | 104% | 91% |
(CPU is reported the way docker stats reports it: 100% is one full core. This run is on a small, shared hypervisor guest. On a dedicated machine the same load costs noticeably less CPU, as the numbers below show.)
Read down the throughput column: about 6,000 messages a second at 1,000 subscriptions, about 138,000 at 10,000. Linear. Ten times the subscriptions, ten times the messages. Not one subscription in error, anywhere in the run.
Then read down the memory column, and you find the ceiling.
Memory is the ceiling, and that is good news
On that same 4-core, 4 GiB box, the collector ran out of memory long before it ran out of CPU. At 10,000 subscriptions it held 2.88 GiB of RAM with the host at 91%. One step further and the OOM killer would have ended the run. CPU, meanwhile, was still only around a core.
That sounds like a limit. It is actually the most useful thing we found, for one reason: it is linear, and it is predictable.
Across every run, on two very different machines, the collector cost about 0.25 MiB of RAM per subscription, on top of a roughly 150 MiB base. That is not a curve that surprises you at 2am. It is arithmetic:
RAM ≈ 150 MiB + (0.25 MiB × subscriptions)
There are two honest ways to read memory here. The collector's dashboard shows its Go heap, the few hundred MB it has actively allocated. The table above counts the whole container's resident memory, RSS, which is larger and is what you actually reserve on a VM. Size against the RSS number and you have headroom, not a surprise.
Want 20,000 subscriptions? Plan for roughly 5 GiB and you are done. There is no hidden point where the curve suddenly bends, no queue that backs up and makes the collector start dropping data. The resource that runs out first is the one you can read off a spec sheet and buy more of.
That is the difference between "it scales" as a slogan and "it scales" as a number you can size a VM against.
What predictable actually buys you
Two things stayed true from 100 devices to ten thousand subscriptions, and both are the point.
- It stayed honest under load. Right up to the memory wall, throughput matched the work and no messages were dropped. A collector that quietly drops telemetry when it is busy is worse than one that does not collect at all. You end up trusting data that is already incomplete. This one moves what it is told to move until it physically cannot, and then the limit shows up as memory, not as a silent gap in your graphs.
- It behaved the same on different hardware. A Mac and a loaded hypervisor guest produced the same throughput and the same memory curve, within a few percent. CPU cost more on the contended box, as you would expect. But the shape did not change. That is what lets you measure on something small and size for something large.
Sizing it for your fleet
You can prove the number rather than hope for it. Take your device and subscription count, multiply by 0.25 MiB, add the base, and size the box. The collector will use the CPU it needs, which at these rates is not much, and move the messages you ask it to.
Try it on your own network
Prelude Collector is free for up to 20 devices. A single docker compose up -d and you are collecting. Twenty devices is plenty to see the whole pipeline end to end: normalize a few vendors into one model, send it to Grafana, and watch the resource numbers move for yourself.
And if your fleet is bigger than twenty, whether that is a hundred or a thousand or more, that is not the part to worry about. The scaling is linear, and we have run it into the tens of thousands of subscriptions on a single box. Reach out and we will size it with you, and get you a license for the whole fleet.